Using SUS to Analyze and Report Feedback

Find out how Linguamatics used UX metrics to gain usability insights, support product decisions, and increase engagement with stakeholders.

SUS

3 minute read

Using SUS to Analyze and Report Feedback from Usability Testing

Linguamatics’ software solutions team was working on a new application. The team wanted a way to gather and present meaningful feedback from usability testing during development.

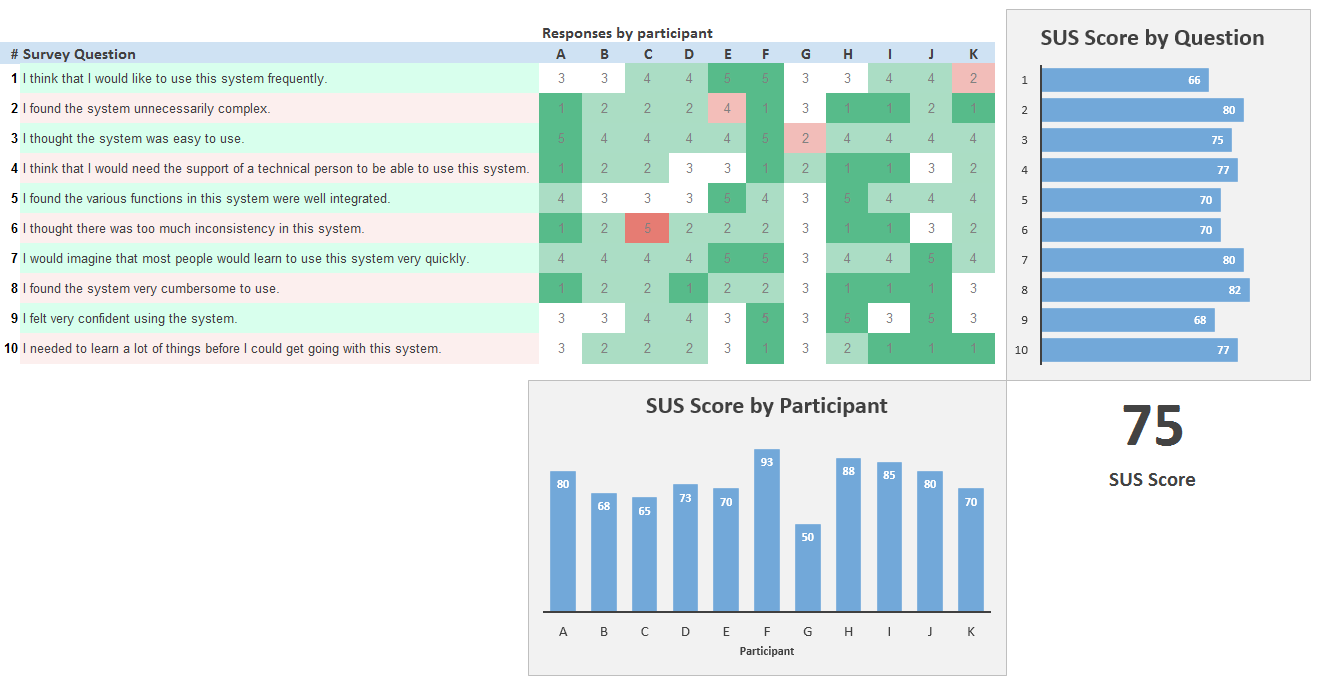
When presenting feedback to stakeholders we wanted to show reliable and tangible usability metrics that could compare rounds of usability testing to show progress. We also wanted to show evidence of how the metrics were determined.

After researching a wide variety of usability and user experience metrics, the System Usability Scale (SUS) was selected as a preferred method. SUS is a long-standing, reliable, and flexible method. With 10 questions it provides a good level of detail, without overwhelming participants.

Process

Plan and Conduct

When an early interactive prototype of our project was ready to be shown to people, we began usability testing of the application. The SUS questionnaire was developed using Google Forms, and a paper version was produced. Additionally, a short survey was included with the standard 10 SUS questions.

Immediately after each session, participants were asked to complete the questionnaire using the paper form or the online version. The same survey was utilized for each round of usability testing, with the number of participants varying from 6 to 16.

Analyze and Report

Participants’ SUS responses were processed according to the SUS calculations. The scores were examined for individual participants, and for different groups of participants. For example, we compared responses of those familiar with Life Sciences terminology to those who were not. We also looked at subsets of questions, for example questions 4 and 10 particularly address learnability, while others cover usability.

From the results, we prepared one detailed report and one overview report. In the detailed report we prepared bar charts of the SUS calculations by participant and by question. Combining both of these dimensions yielded a heat-map with positive and negative reactions, similar to that shown in Figure 1.

For the overview report, the SUS score was presented with the top few takeaways listed. It was visualized with a ‘weather outlook’ using familiar symbols, similar to Figure 2.

Figure 1: Detailed view of SUS calculations by question, by participant, a heat map matrix, and the SUS score (for illustrative purposes only).

Figure 1: Detailed view of SUS calculations by question, by participant, a heat map matrix, and the SUS score (for illustrative purposes only).

Figure 2: An overview report for presenting SUS results (for illustrative purposes only).

Figure 2: An overview report for presenting SUS results (for illustrative purposes only).

Outcome

The stakeholders had a tremendously positive reaction to the SUS report. They immediately grasped the simple but tangible metrics. Our stakeholders also valued the evidence of the bar charts as a relatable insight into the way scores were distributed. The SUS score enabled our team and stakeholders to assess product usability in a way that they had not previously been able to do.

Comparing several usability testing sessions, we were able to show increases in the SUS score. Changes in the scores for some individual questions were able to be attributed to changes in the product. For example, adding guided help increased the ability for users to use the product without ‘seeking the support of a technical person’. Conversely, some early product features resulted in a change to the perceived ’inconsistency in the system’. Seeing this feedback ensured such problems were addressed quickly.

Conclusion

Although the headline statistics from the SUS method are quite simple, the collection, analysis, and reporting process gave our team valuable usability insights. The SUS method provided evidence to support decisions on where to focus effort. It also provided us with a transparent and comparable source of data, and enabled us to present results of usability testing to stakeholders in an engaging and memorable way.