Using the HEART framework to define quantitative metrics for the Open Targets Platform

Find out how Open Targets used the HEART framework to define quantitative metrics collaboratively and supplement qualitative user feedback.

7 minute read

Using the HEART framework to define quantitative metrics for the Open Targets Platform

The Open Targets Platform (www.targetvalidation.org) supports scientists working on drug discovery in academia and the pharmaceutical industry to identify and prioritize drug targets faster and with more confidence. We applied Lean User Experience (UX) design methods to understand and address the needs of our users (for more details see Karamanis et al. 2018). In this case study, we outline how we supplemented qualitative user feedback with quantitative metrics which were defined collaboratively using the HEART framework (Rodden et al. 2010).

Process

We designed the Open Targets Platform following a collaborative and iterative design process (Karamanis et al. 2018). Qualitative feedback from users has been at the heart of this process. In addition to helping us understand what needs to be improved, this feedback helps us assess whether we have met our main objective.

By the time the platform was made available publically, we had collected a lot of feedback from users testifying that it was comprehensive and intuitive. Users also shared cases in which the platform helped them with their day to day activities in drug target identification (see Karamanis et al. 2018 Supplementary Table 1).

We supplemented the qualitative feedback from users with quantitative metrics. Brainstorming a long list of metrics can quickly get unwieldy and difficult to prioritize. In order to avoid this problem, we identified key performance indicators using the HEART methodology. This methodology breaks down the experience of using a product into five aspects: Happiness, Engagement, Adoption, Retention and Task completion (Rodden et al. 2010).

The importance of each aspect of the HEART methodology varies from product to product. For the Open Targets Platform, we decided to focus on Adoption, Engagement and Retention (in that order) for the definition of quantitative metrics because these aspects can be captured regularly and more directly through web analytics. Although we use qualitative feedback (see Karamanis et al. 2018 Supplementary Table 1) as the main indicator of Happiness, we intend to start surveying our users periodically in order to monitor differences in the Net Promoter Score (Reichheld 2003) between major updates of the Platform. Task completion is less relevant to our application since using the platform is much more open-ended than, for instance, making a purchase online (which has a clear completion action).

We defined high level goals and lower level signals for the prioritized aspects as well as actual metrics for each aspect. The members of our multidisciplinary team were invited to contribute to these definitions, similarly to how they participated in our collaborative user research, design and testing activities. This process helped us clarify the purpose of collecting analytics before investing effort in the actual way in this will be done. We review the statements of goals, signals and metrics periodically, with the most recent version shown in Table 1.

Goals Signals Key Metrics
Adoption We want people to be visiting the site and viewing its pages. Visiting site, Viewing pages Visits per week, Unique visitors per week, Pageviews per week, Unique pageviews per week
Engagement We want people to be using the site and performing certain actions. Spending time on site, Searching the site, Downloading information, Clicking on evidence links Average visit duration, Bounce rate per week, Actions per week, Actions per visit
Retention We want people to come back to the site after their first visit. Returning to the site Returning visits, % returning visits / all visits

Table 1: Following the HEART methodology, we prioritized Adoption, Engagement and Retention as the aspects of user experience to focus on for the definition of quantitative metrics. We collaboratively defined high level goals for each of the prioritized aspects and then identified lower level signals as well as actual metrics for each aspect.

Outcome

When we started communicating these metrics to external stakeholders, we realized that it was easier for them to comprehend if the goals and signals columns of Table 1 were replaced with a simple question that the metrics are designed to answer, as shown in Table 2. Table 2 states the averages of these metrics from the beginning of April 2016 until the end of March 2017 (as reported in Karamanis et al. 2018).

The metrics suggest that the Open Target Platform has been used substantially during that period. This accords with the positive feedback that we have been receiving from users and the fact that a new industrial partner joined Open Targets and started contributing to the development of the platform soon after the public release.

Question Metrics Average
Adoption Are people visiting the site and
viewing its pages?
Visits per week
Unique visitors per week
Pageviews per week
Unique pageviews per week
816.35
529.58
4785.19
3343.42
Engagement Are people using the site and performing certain actions
(internal site searches, downloads, clicking on evidence links)?
Average visit duration
Bounce rate per week
Actions per week
Actions per visit
6min 49sec
25.60%
9401.33
11.29
Retention Are people coming back to the site? Returning visits per week
% returning visits / all visits
460.38
56.67%

Table 2: Key metrics for the period from the beginning of April 2016 until the end of March 2017. These metrics suggest that the Platform is being used substantially, in accordance to the positive feedback that we have been receiving from users.

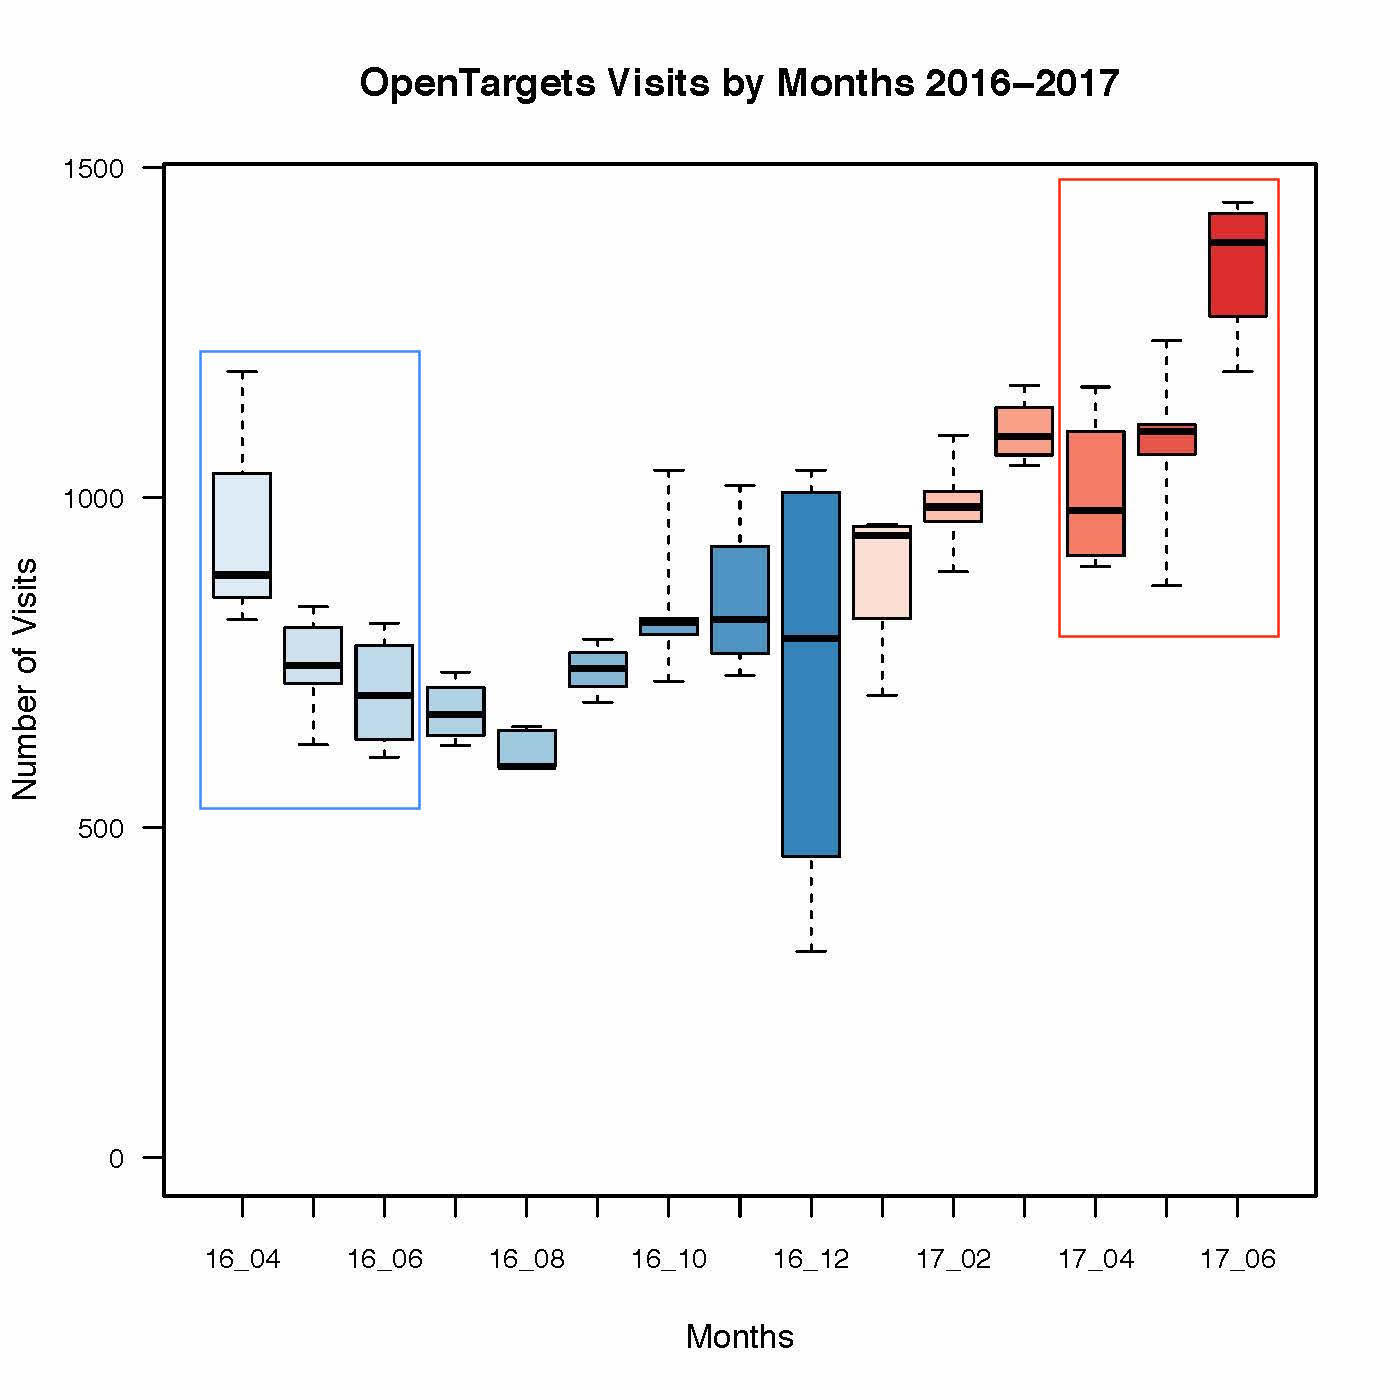
We have also used these metrics to identify trends. For example, Figure 1 shows that the number of weekly visits (depicted as monthly boxplots) in 2017 has increased compared to 2016.

Figure 1: Visits per week depicted as boxplots per month from April 2016 until June 2017. The Figure reveals an increasing trend in 2017 (red boxplots) compared to 2016 (blue boxplots), particularly for the second quarter of each year (April to June: see boxplots in blue vs red frames as a more direct comparison).

Figure 1: Visits per week depicted as boxplots per month from April 2016 until June 2017. The Figure reveals an increasing trend in 2017 (red boxplots) compared to 2016 (blue boxplots), particularly for the second quarter of each year (April to June: see boxplots in blue vs red frames as a more direct comparison).

Appendix: HEART vs AARRR

Our prioritisation of metrics corresponds to the “Startup Metrics for Pirates”, which are based on the customer lifecycle funnel (Gothelf & Seiden 2016: pp. 33-34):

HEART framework for Open Targets Startup Metrics for Pirates
Adoption Acquisition See Table 1 above for Goals Signals and Metrics defined for Open Targets
Engagement Activation See Table 1 above for Goals Signals and Metrics defined for Open Targets
Retention Retention See Table 1 above for Goals Signals and Metrics defined for Open Targets
Happiness Referral E.g. using NPS (although for Open Targets we have relied more on collecting qualitative feedback regularly as part of our design and testing process)
Task Completion Revenue E.g. making purchases (less relevant to Open Targets)

The “Startup Metrics for Pirates” framework is abbreviated into AARRR (hence the reference to Pirates). New customers start with Acquisition and move through increasing levels of engagement with a service (ultimately leading to increasing Revenue). We can see AARRR as a basis of prioritising the elements of the HEART framework and use the HEART (or in that case AERHT) methodology to define goals, signals and metrics for each element as demonstrated in Table 1.

References